

the mathematics of multi-tenancy
why multi-tenancy works for S3, but might not work for you

There was an interesting thread on X the other day where an S3 customer’s bucket migration resulted in a swarm of 503 errors coming from S3. The root cause came down to the way S3 prevents users from explicitly defining partitions. That decision surprised me since, as an infrastructure engineer, I very much like to have control over what subsets of my data are co-partitioned.
I started pulling on that thread and the result is a statistical model that helps better understand multi-tenancy.
why S3 doesn’t let you control partitioning
S3 documents that a partitioned prefix can handle ~5k GET requests/s, but users don’t have control over the physical partition placement. Instead, S3 learns your workload patterns and then uses statistics to evenly distribute frequently accessed data.
I recently re-read Building and operating a pretty big storage system called S3 by Andy Warfield and there’s a section in that post that expertly visualizes why they do this. While individual users’ workloads are spiky, aggregating the workloads of millions of tenants results in a relatively flat and predictable usage pattern:
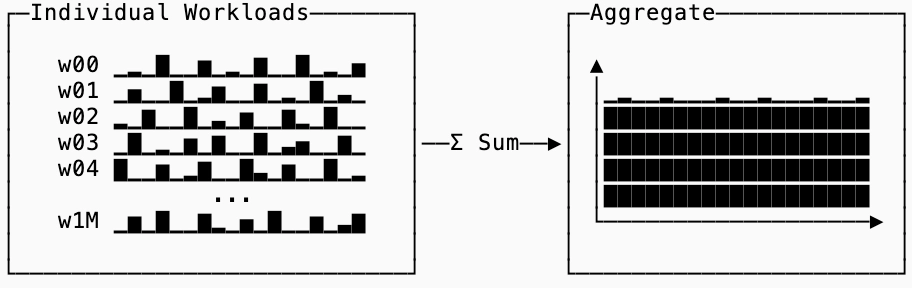
The catch is that this only works when workload spikes are uncorrelated. If you place all of the data from a particular user on the same machines, you don’t get any amortization. Similarly if you place users with correlated usage patterns on the same machines, you get the opposite effect of what you want. By predicting workload patterns, S3 can place what they believe to be workloads that are uncorrelated on the same disks.
In theory this makes a lot of intuitive sense, and I believe this works for S3, but despite working at companies with massive scale (LinkedIn & Confluent) I was never able to get anywhere near this nice of a workload aggregate flattening effect for my systems.
modeling workload distribution
To build an intuition for why, I built a statistical model (that’s deployed as a webpage you can play around with) that has a few knobs that affect how the individual workloads are distributed. The key output of the model is the heat ratio H between the peak workload and the average workload:
There are various inputs to the model, but first we’ll focus on just the population size N (how many distinct workloads are running).
an idealized multi-tenant setup
We’ll start with a baseline simulation. In this simulation all workloads are randomly generated with no correlation between them so each contributes roughly equally to the overall. This simulation shows the aggregate workload as you add more individual workloads to the fleet:
This demonstrates exactly what we want to see from a multi-tenant system. As we add more workloads to the pool (N increases) the ratio between peak utilization and average utilization shrinks to almost exactly 1.0.
This is great. It means that any individual tenant running on their own would need to provision for peak but a multi-tenant system hardly needs to over-provision.
A foundational argument in support of multi-tenancy is that it enables a vendor to provide a service to you at lower cost than if you ran it yourself. In other words, your workload has some value of H that is sufficiently larger than the vendor’s H once you aggregate the entire workload that they can still take margin despite charging you less than the cost of self-hosting. For the sake of this blog, let’s assume that the economics work out when the vendor’s H <= 2.0 (their peak workload is no more than twice their average).
This graph shows H plotted on the y axis and the number of tenants on the system given the setup:
With the parameters of this simulation, the vendor can cross the modeled breakeven threshold with about 200 tenants running on their system.
correlation corrodes multi-tenant efficiency
The previous simulation assumed that workloads were completely independent from one another.
In practice, few companies have this luxury as there are many factors that might contribute to correlated workloads: if you have customers in the same time zone it’s likely they are more active during business hours or perhaps your customers have seasonality (e.g. big shopping holidays) that cause correlated spikes.
We can model correlation by splitting the RNG into two components, a shared one for all workloads and an independent one generated for each. We introduce a new variable ρ to represent the contribution percentage of the shared vs. independent RNGs. When ρ=0 the shared component is 0% of the value, and when ρ=1 the independent component is 0% of the value.
It doesn’t matter how many customers you have, if their workloads are correlated you will never get the nice smoothing characteristic that you get from uncorrelated aggregations. This simulation shows what happens as you go from ρ=0 → ρ=0.5 (representing a 50% shared component in workloads):
In this example, the economics get dicey around a 25% shared component in workloads when H creeps near 2.
size skew flattens the curve
Both previous simulations had another unreasonably friendly assumption: that all workloads contributed roughly equally to the overall load. This is almost never true and most real world distributions follow the Pareto Principle where 20% of the workloads account for 80% of the volume.
This doesn’t raise the floor for H the way correlation does, but it does mean that a multi-tenant system needs many more tenants before the smaller ones start to pool together to add up to anything significant.
To model this, I introduced another variable that represents the size of the workload, and a size skew parameter k. At k = 0 every workload is the same size, and as k → 1 a handful of giant workloads come to dominate while the rest shrink. You can see how this parameter affects the simulation as it increases with a fixed population size (simulated with correlation at 0%):
What used to look extremely efficient is no longer the case when the workload is skewed toward a few large instances. With an 80:20 distribution, again H gets really close to 2.0, even assuming entirely uncorrelated workloads.
why S3 is perfectly set up for multi-tenancy
There are three reasons why S3 is set up so well for multi-tenancy:
It’s got a massive number of tenants.
S3’s API is so foundational that it can serve as the foundation for a wide variety of use cases ranging from warehouse analytics to stream processing to vector databases.
Since S3 uses Reed Solomon error coding to split objects, the unit of tenancy is a file split (not even a full object!)
These characteristics map almost perfectly 1:1 with the sections discussed in this blog post. The more tenants a system has, the smoother a shape the aggregation takes. Having a basic API means that there is such a wide range of workloads that they are unlikely be highly correlated in aggregate. Making an object-split the unit of tenancy means that even if there is a Pareto distribution amongst the customers, an object can be split onto many shards to prevent them from creating hot spots.
fsync()
If you are building infra, you should consider this deeply before you assume that multi-tenancy is the wedge that will drive down your pricing.
I had a chat with David Gu, the author of the X thread I opened this post with, about recall.ai’s workload and how it stresses S3. Since they run an infrastructure service that records meetings their workloads are highly correlated to meeting start times, which tend to be at the top of the hour. For their product, multi-tenancy doesn’t flatten their aggregate curve and can even make the peak / average ratio more dramatic.
This is where building on already massively multi-tenant systems like S3 is useful. While it won’t fix a correlation problem in your application, it lets you push a lower layer of the problem onto a system that can multiplex your workload with many other different ones. In Recall’s use case, they still buy the same S3 product as everyone else despite the bursty workload.
That’s it for now! If you’re a math nerd or you want to find gaps in my statistical model, the simulation code is all available on GitHub: github.com/agavra/heat-sandbox